Tuesday, August 18, 2026
Coding Agents at Production Scale: What 761M LLM Calls Reveal
Posted by
Most LLM serving research is built around chatbot-shaped workloads: short, independent, stateless requests. Coding agents are a different animal. A new study from Microsoft Research gives us the first production-scale picture of that workload — 3.2M users, 13M sessions, 761M LLM calls, 95T tokens, and 775M tool invocations, drawn from a week of GitHub Copilot traces in June 2026, spanning 27 models and 45 tools. The findings matter for anyone running agent pipelines on their own infrastructure.
Coding Agents ≠ Chat
The structural difference is stark. In agentic coding:
- 87% of turns are agent-initiated — the user prompts once, and the agent runs an autonomous loop
- LLM calls couple nearly 1:1 with tool execution
- Sessions are sequential, not parallel: one context grows across the whole run
- Token consumption is violently heavy-tailed
The tail is worth pausing on. The median session is 3 user turns, 15 LLM calls, and 4.2 minutes. The mean is 6.1 turns, 40.6 calls, and 62.6 minutes — and the P90 session exceeds 100 LLM calls and 3 hours. That's a 14.9× mean-to-median skew. A small fraction of long sessions dominate serving load, and those are exactly the sessions whose KV cache you're holding in GPU memory.
Serving systems built for stateless chat requests are mismatched with this workload — which is why cache behavior, compaction, and failure handling dominate the cost picture.
The Cache Cliff
Prompt-prefix caching is the backbone of agent economics. Each call carries a median prompt of 68K tokens, of which a median 63K are already cached. Within a turn, the append-only context is a natural caching win — median hit rates hit 98%, and the trajectory is predictable: ~45% on the cold-start call, ~86% by call two, and a 92–94% plateau from call three onward.
But the session structure breaks that prefix, and it breaks it at predictable points:
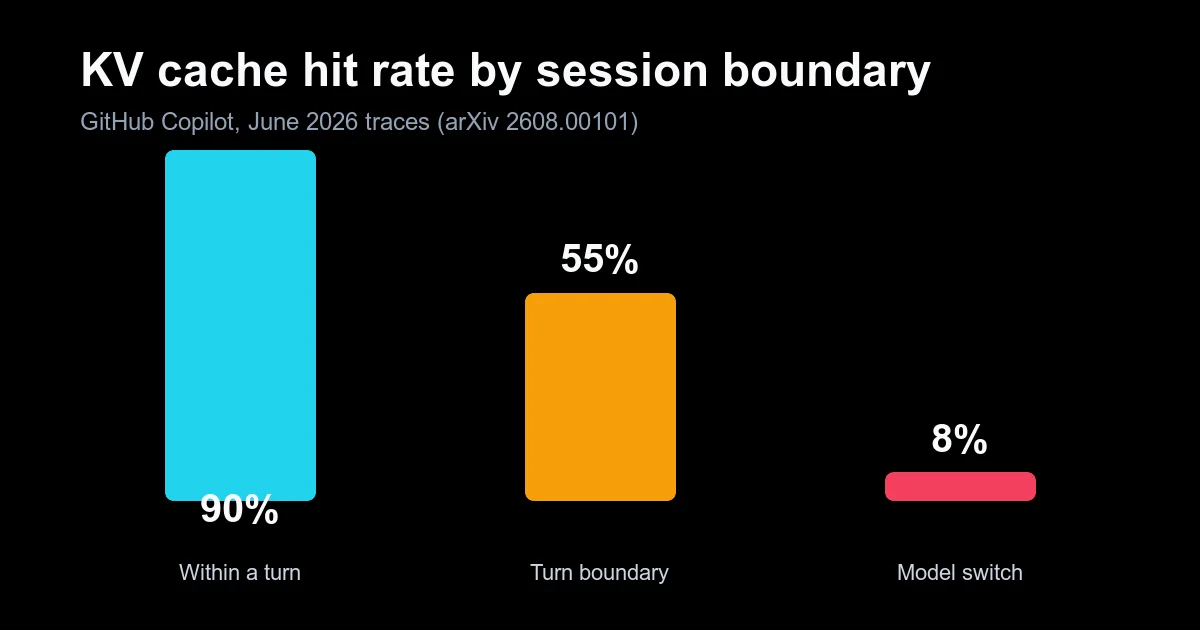
| Boundary | Cache hit rate |
|---|---|
| Within a turn | 90% (median 98%) |
| Across turn boundaries | 55% |
| After a model switch | 8% |
Two events destroy cache value, and both are costly:
Model switches — routing mid-session to a different model effectively cold-starts the cache. Only 8% of tokens remain cached after a switch. Every model change mid-workflow — for load balancing, A/B testing, or tier routing — is a cache reset you're paying full prefill for.
Context compaction — when the agent hits its context window, it rewrites the prompt to buy room, dropping or summarizing older messages. Compaction is rare at the session level — 7.8% of sessions compact at least once (22.6% of long-context sessions over 100K tokens) — but those sessions are monsters: they consume 44.2% of all tokens and 37.1% of all LLM calls. When compaction does fire, it's aggressive:
- The median event drops 72.8% of prompt tokens (middle half: 58–81%); 6.1% of events drop 90% or more
- The rewritten prompt shares little prefix with the cached one, so the first call after compaction sees a median 66.1% drop in cache hit rate
- 34.3% of events erase 90% or more of cache hit rate; 21% erase 99%+
Compaction is a cache reset in the same league as a model switch — except it's the one you trigger yourself, as a side effect of managing the context window.
For anyone running agents, this validates a rule of thumb: don't switch models mid-task, and treat auto-compaction as a cold start you're paying for. Anything that keeps a session on one model, keeps idle gaps under two minutes, and preserves cacheable prefixes cuts cost directly.
Failure-Driven Compute Amplification
The most agent-specific finding: when a tool fails, the agent retries — and the retry loop is exponentially expensive.
- 9.1% of turns are deep loops with failures, averaging 36 LLM calls — 4× the median — each processing 80K+ tokens including accumulated error output
- In chat, a failed request returns an error. In an agent, a failure triggers an autonomous recovery attempt that cascades into dozens of LLM calls with a growing context window
- Tool failures drive 9% of turns to 4× compute via retry loops
The practical implication: a failure budget beats retries. Circuit-breaker your agent loops — the longer a loop runs after a failure, the more it amplifies cost. (We cover the breaker pattern in the guardrails guide.) And since tool output feeds the growing context, reliable tools with clean error output are a serving-efficiency win, not just a reliability nicety.
Idle Patterns You Can Exploit
Agent workloads are bimodal. Within a turn, idle gaps are short — 5.8s of container idle, 1.2s of KV cache idle — as the loop alternates between GPU inference and tool execution. Across turn boundaries, the user is thinking: minutes of idle (243s container, 172s KV cache — the paper reports 4.1 and 2.9 minutes).
Turn boundaries are a natural trigger for evicting sandbox containers and offloading KV cache. The paper maps the cliff precisely: hit rates hold above 95% for idle gaps under two minutes, collapse to ~70% across the 2–10 minute window, and approach zero beyond ten minutes. A lightweight idle-time predictor captured 86–90% of total idle time — enough to drive proactive resource management without heavy machinery.
Users Are Not One Workload
A final wrinkle: five distinct user archetypes span a 50× range in token consumption per turn (from 23K to 1.1M tokens). They differ in tool usage, idle profiles, session statefulness, and latency sensitivity. Uniform resource policies are measurably suboptimal — serving systems that can't tell a heavy agentic session from a light batch user are over-provisioning for some and starving others.
The Takeaway
Four numbers summarize the workload: 87% autonomy, a 90→55→8% cache cliff, 4× compute amplification on tool failures, and minutes of idle at turn boundaries. For agent operators, the playbook is: keep model identity stable mid-session, budget for compaction as a cold start, put a circuit breaker on failing loops, keep idle gaps under two minutes, and reclaim resources at turn boundaries.
Applied to your own pipeline, the study's findings become concrete rules of thumb:
- Model the cache hit rate, not the token price. A session that churns context is a 90%-hit session in disguise — and the Gemini 3.7 Flash pricing makes the cache-hit multiplier explicit. Long-lived sessions are only economical when the shared prefix stays stable.
- Treat compaction as the cold start it is. 7.8% of sessions (22.6% of the long-context ones) consume 44.2% of tokens and 37.1% of calls; plan capacity for it rather than treating it as a rounding error.
- Watch the tail. The 14.9× skew between median and mean calls means a handful of heavy sessions dominate your infrastructure bill. Autonomy is the goal — but the autonomy this study measures is what a serving layer makes possible, not a property of the model alone.
For the architecture side of the same lesson — what actually breaks when an agent serves real users — see what building Shippy taught Allen AI.
This is also a useful lens on harness token overhead: the harness system prompt is amortized across a long autonomous loop, but cache stability decides the actual bill.
Related Articles & Deep Dives
 #harness-if
Harness-IF: Are Coding Agents Following Rules, or Just Doing What They'd Do Anyway?
A benchmark that separates compliance from coincidence: every model is worse at rules opposing its defaults — and where you put the rule changes everything.
 #swe-rpg
SWE-RPG: Coding Agents Fail at Implicit Requirements, Not Code
Agents resolve only 31.5% of real issues — and implicit requirement recovery is the biggest bottleneck (24.5–46%). The fix is asking clarifying questions.
 #swe-touch
SWE-Touch: Coding Agents Break When Users Touch the Code
Coding agents drop 7.7 points on SWE-bench Verified when users edit code mid-task. They don't re-inspect the workspace, and open models degrade most.