GPT Image 2 Infographic and Diagram Prompts
Build readable GPT Image 2 infographics with clear sequences, short labels, verified facts, and layouts that make relationships easy to scan.
Use GPT Image 2 to turn a compact, well-defined brief into an infographic or process diagram. The examples below cover a cycle, a system flow, and a production sequence. Each prompt specifies the order, labels, arrows, and visual hierarchy instead of asking for a vague “informative graphic.”
Generated visuals can make text look authoritative even when it is wrong. Verify source facts, labels, and relationships before publishing or using an infographic to teach.
Three infographic structures
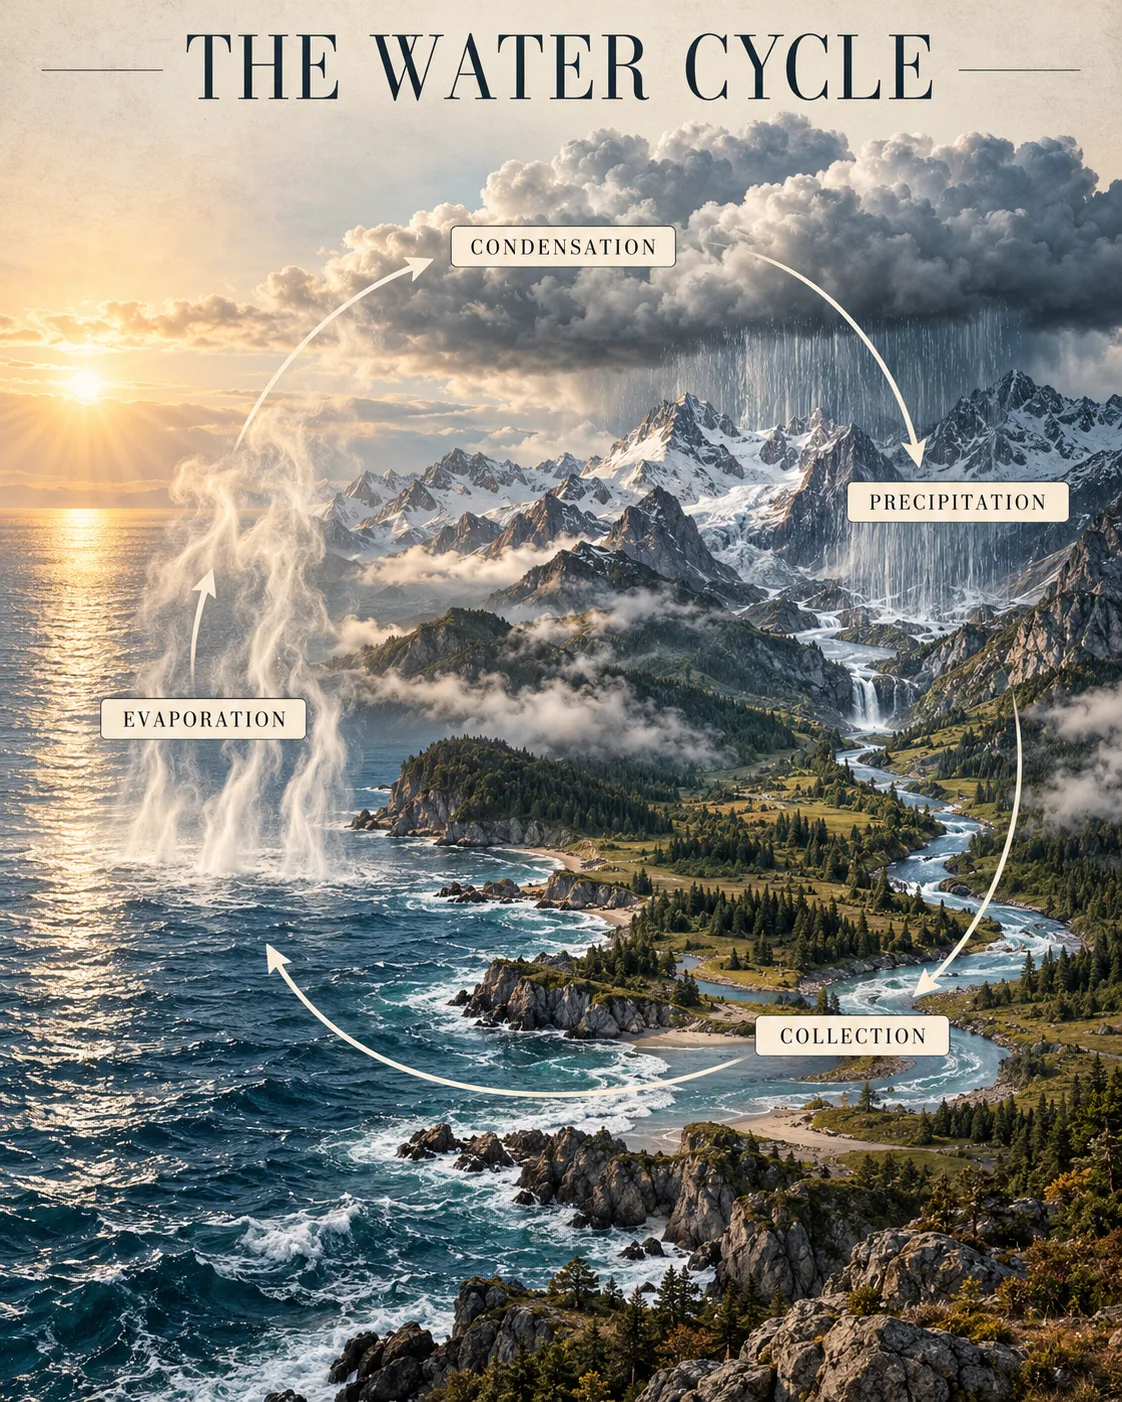
Water cycle: circular process
The water cycle works well as a loop because each stage returns to the starting body of water. The prompt assigns each label to a visible event and gives the arrows a clockwise direction.
Create a premium 4:5 portrait science-magazine infographic titled “THE WATER CYCLE”. Art direction: an elegant natural-history editorial plate, atmospheric and cinematic rather than cartoonish. Show a richly detailed landscape cross-section from deep blue ocean through a pale-stone mountain valley: warm sunlight over the sea, translucent vapor rising, a sculptural cloud forming over the peaks, rain over the mountains, and a river returning to the ocean. Use a sophisticated palette of ink navy, sea-glass teal, mist gray, warm limestone, and a small ochre sun. Integrate four fine-line arrows into one clear clockwise cycle. Add four restrained ivory caption tabs with exactly these labels: “EVAPORATION”, “CONDENSATION”, “PRECIPITATION”, “COLLECTION”. The arrows and landscape must show the sequence accurately. Use refined editorial typography, subtle paper texture, precise spacing, dramatic natural light, and print-quality detail. No cute clip art, no childish vector style, no extra facts, no extra text, no logos.
Solar energy: system flow
This diagram uses a simple left-to-right flow. The “DC” and “AC” markers describe the type of electricity on either side of the inverter without adding numerical claims.
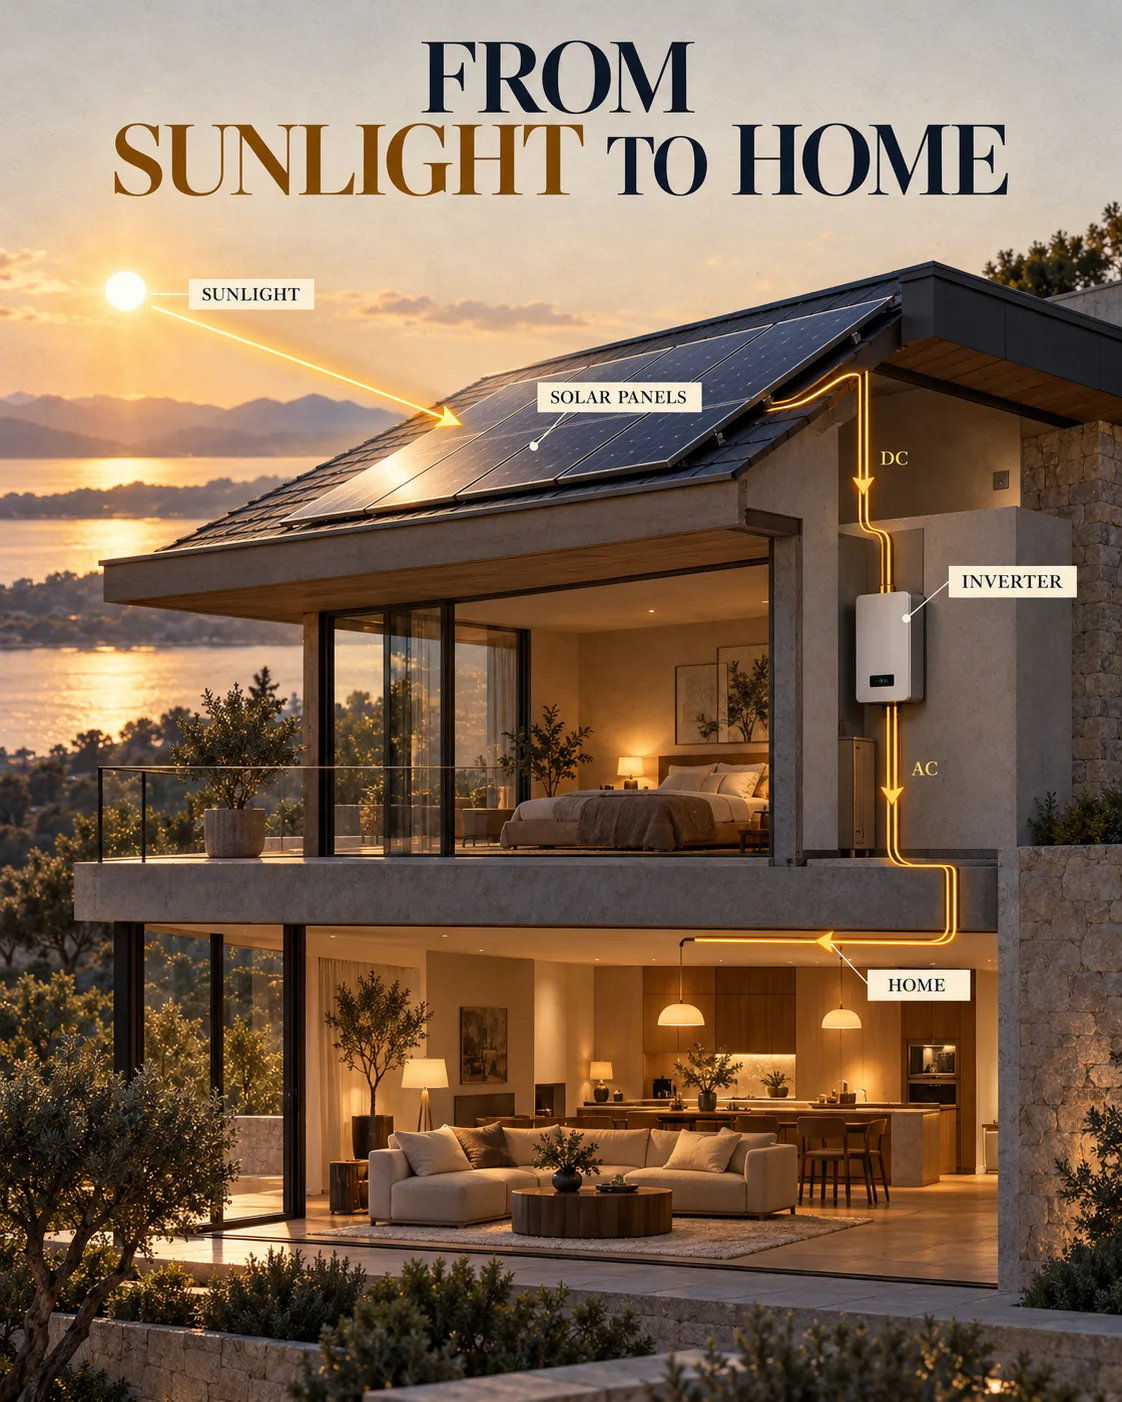
Create a premium 4:5 portrait energy infographic titled “FROM SUNLIGHT TO HOME”. Art direction: an editorial architecture-and-science magazine spread, cinematic but precise, with warm limestone, ink navy, muted amber, and subtle teal annotations. Build a realistic cutaway scene of a refined modern home at late afternoon: sunlight falls across rooftop solar panels, a discreet wall-mounted inverter sits in a utility alcove, and warm interior lights glow below. Connect the components with one elegant, clearly directed energy path using fine amber lines and arrows. Show four small ivory labels in sequence: “SUNLIGHT”, “SOLAR PANELS”, “INVERTER”, “HOME”; mark the wire from panels to inverter “DC” and the wire from inverter to home “AC”. Keep the electrical flow physically clear. Use sophisticated typography, paper grain, natural materials, precise labels, museum-quality print finish. No cartoon icons, no childish vector art, no extra facts, no numbers, no additional text.
Coffee: ordered production steps
The final example is a linear process. Repeating the same icon scale and downward arrow keeps attention on sequence rather than decoration.
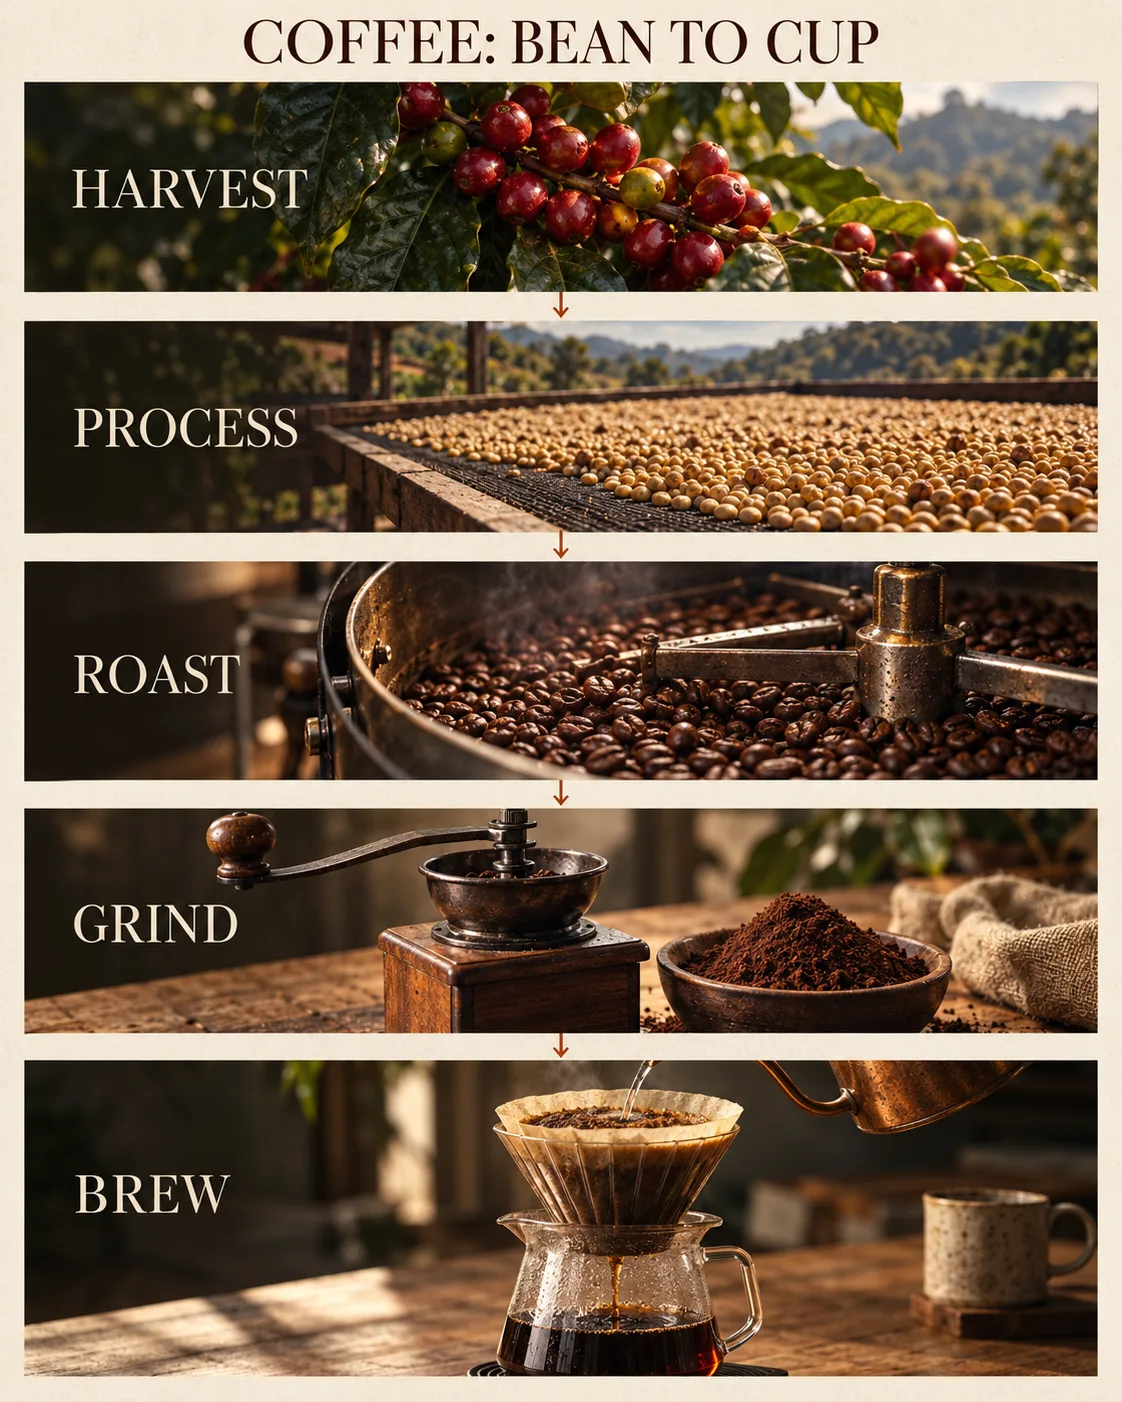
Create a premium 4:5 portrait coffee-process infographic titled “COFFEE: BEAN TO CUP”. Art direction: a luxury food-magazine visual essay, warm ivory uncoated paper, espresso brown, deep olive, muted copper, natural side light, subtle film grain. Arrange five rich photographic still-life stages in a vertical sequence, linked by refined thin copper arrows: ripe coffee cherries on a branch, beans drying on a raised mesh bed, beans inside a small roasting drum, freshly ground coffee beside a hand grinder, and a precise pour-over into a glass carafe. Give each stage its own generous panel and consistent editorial crop. Use only these exact labels: “HARVEST”, “PROCESS”, “ROAST”, “GRIND”, “BREW”. Typography should be elegant and legible, like an art-directed print feature, with tactile materials and beautiful light. No cute illustration, no clip art, no extra facts, no quantities, no extra copy, no logos.
Make information graphics easier to read
- Choose one structure: loop, sequence, comparison, or hierarchy.
- List the exact labels before prompting: short text is easier to render and easier to verify.
- Map each label to a visible object or connection: don’t leave the model to invent the diagram’s logic.
- Limit decoration: reserve visual contrast for the main sequence or relationship.
- Fact-check the final image: especially arrows, units, labels, and any generated numbers.
The GPT Image 2 prompt collection awesome-gpt-image-2 includes chart and infographic examples. These prompts and generated graphics are original examples for PromptGenius.
Related Articles & Guides
 #gpt-image-2
GPT Image 2 Prompts and Workflows
Explore original GPT Image 2 prompts with generated examples for posters, art styles, composition studies, interface mockups, infographics, and photorealism.
 #gpt-image-2
GPT Image 2 Composition Reference Card Prompts
Generate four minimalist composition studies with GPT Image 2: visual core, diagonal momentum, enclosing axis, and sectional partition.
 #gpt-image-2
GPT Image 2 UI Mockup Prompts
Create concept UI screens with GPT Image 2 using explicit layout, design tokens, concise labels, and consistent components.